
Loading scenario…
AKI
μg/mL vs. hr
Population
Individual
Selected
Observations
AKI Periods
Creatinine (SCr)
Waiting for Data
Complete demographics and events to generate a simulation.
Simulation Paused
Update the highlighted field to resume.

Events

Doses, measured levels, and serum creatinine. Add or edit rows and the simulation reruns as you go.

Steady-state mode: the first dose's interval sets the assumed starting concentration, so it's required.
Date Time Value Dur Int

Regimens

Candidate regimens scored against your targets. Click a row to plot it on the chart, or enter your own in the bottom row.

Amount Dur Int AUCSS
No candidate regimens yet — they appear once the simulation has run.
mg
hr
hr
AUC/MIC (24h)
Predicted ±
On target
Time to target
Model disagreement
mg
hr
hr
AUC/MIC (24h)
Predicted ±
On target
Time to target
Model disagreement
Regimens start
Definitions
On target
— the probability that the regimen's steady-state AUC/MIC lands inside your target window, given the prediction's uncertainty.
Time to target
— how long after the regimen starts before exposure first reaches the target. "N/A" means it never gets there over the simulated horizon.
Model disagreement
— the share of a prediction's uncertainty that comes from the models disagreeing, rather than from each model's residual (assay) error.
Toxicity
— the probability that the steady-state trough exceeds the concentration associated with harm.
Efficacy
— the probability that the steady-state trough sits at or above the concentration needed to be effective.

No simulation has run yet. Add doses and demographics to trigger one.

Ensemble Fit
Population (Base)
RMSD μg/mL
Bias μg/mL
Individual (MAP)
RMSD μg/mL
Bias μg/mL
Eff. Models of
Weight Entropy 0–1
# Time Measured Pop Pred Ind Pred Weight
hr mg/L mg/L mg/L 0–1
Population Individual (MAP)
% mg/L mg/L mg/L mg/L
Definitions
Population (Base)
— the model's prediction from its published average parameters, before fitting to the measured levels.
Individual (MAP)
— the same model after Bayesian fitting to the measured levels.
RMSD (Fit)
— typical gap between the predicted and measured levels (µg/mL). Lower is a tighter fit; big misses count more.
Bias
— which way the misses lean: positive predicts high, negative predicts low, near 0 means no consistent lean.
Averaging weight
— how much each model counts toward the blended (ensemble) prediction.
Eff. models
— roughly how many models meaningfully contribute to the blend (1 ÷ Σ weight²). Near 1 means one model dominates; higher means weight is spread.
Weight entropy
— spread of the averaging weights, scaled 0–1. 0 means one model carries everything; 1 means all contributing models weigh equally.
Model disagreement
— the share of a prediction's uncertainty that comes from the models disagreeing, rather than from each model's residual (assay) error.

Full definitions & equations →

No simulation has run yet. Add doses and demographics to trigger one.

Targets
In Target Below Above Time to target
Selected
Not enough history yet — needs at least one completed dosing interval.

Per-model kinetics

Pop Kinetics Ind Kinetics CrCl
CL V1 V2 Q2 V3 CL V1 V2 Q2 V3 CrCl
L/h L L L/h L L/h L L L/h L mL/min
Bayesian Model Averaging

Outside its training range.

Use all models, or manually select a subset. Predictions are averaged, weighted by fit — best once levels are available.

Your model set
Filter
/ sel
Model N Info
No models match.

Optimization Candidates

Select the doses and intervals to simulate when finding a target regimen.

Dose (mg)

Interval (h)

Chorus

Chorus is a vancomycin pharmacokinetic simulator that uses Bayesian model averaging to fit 46 published models to a scenario at once.

Not a validated clinical tool, and not a source of dosing advice.

vanc.app
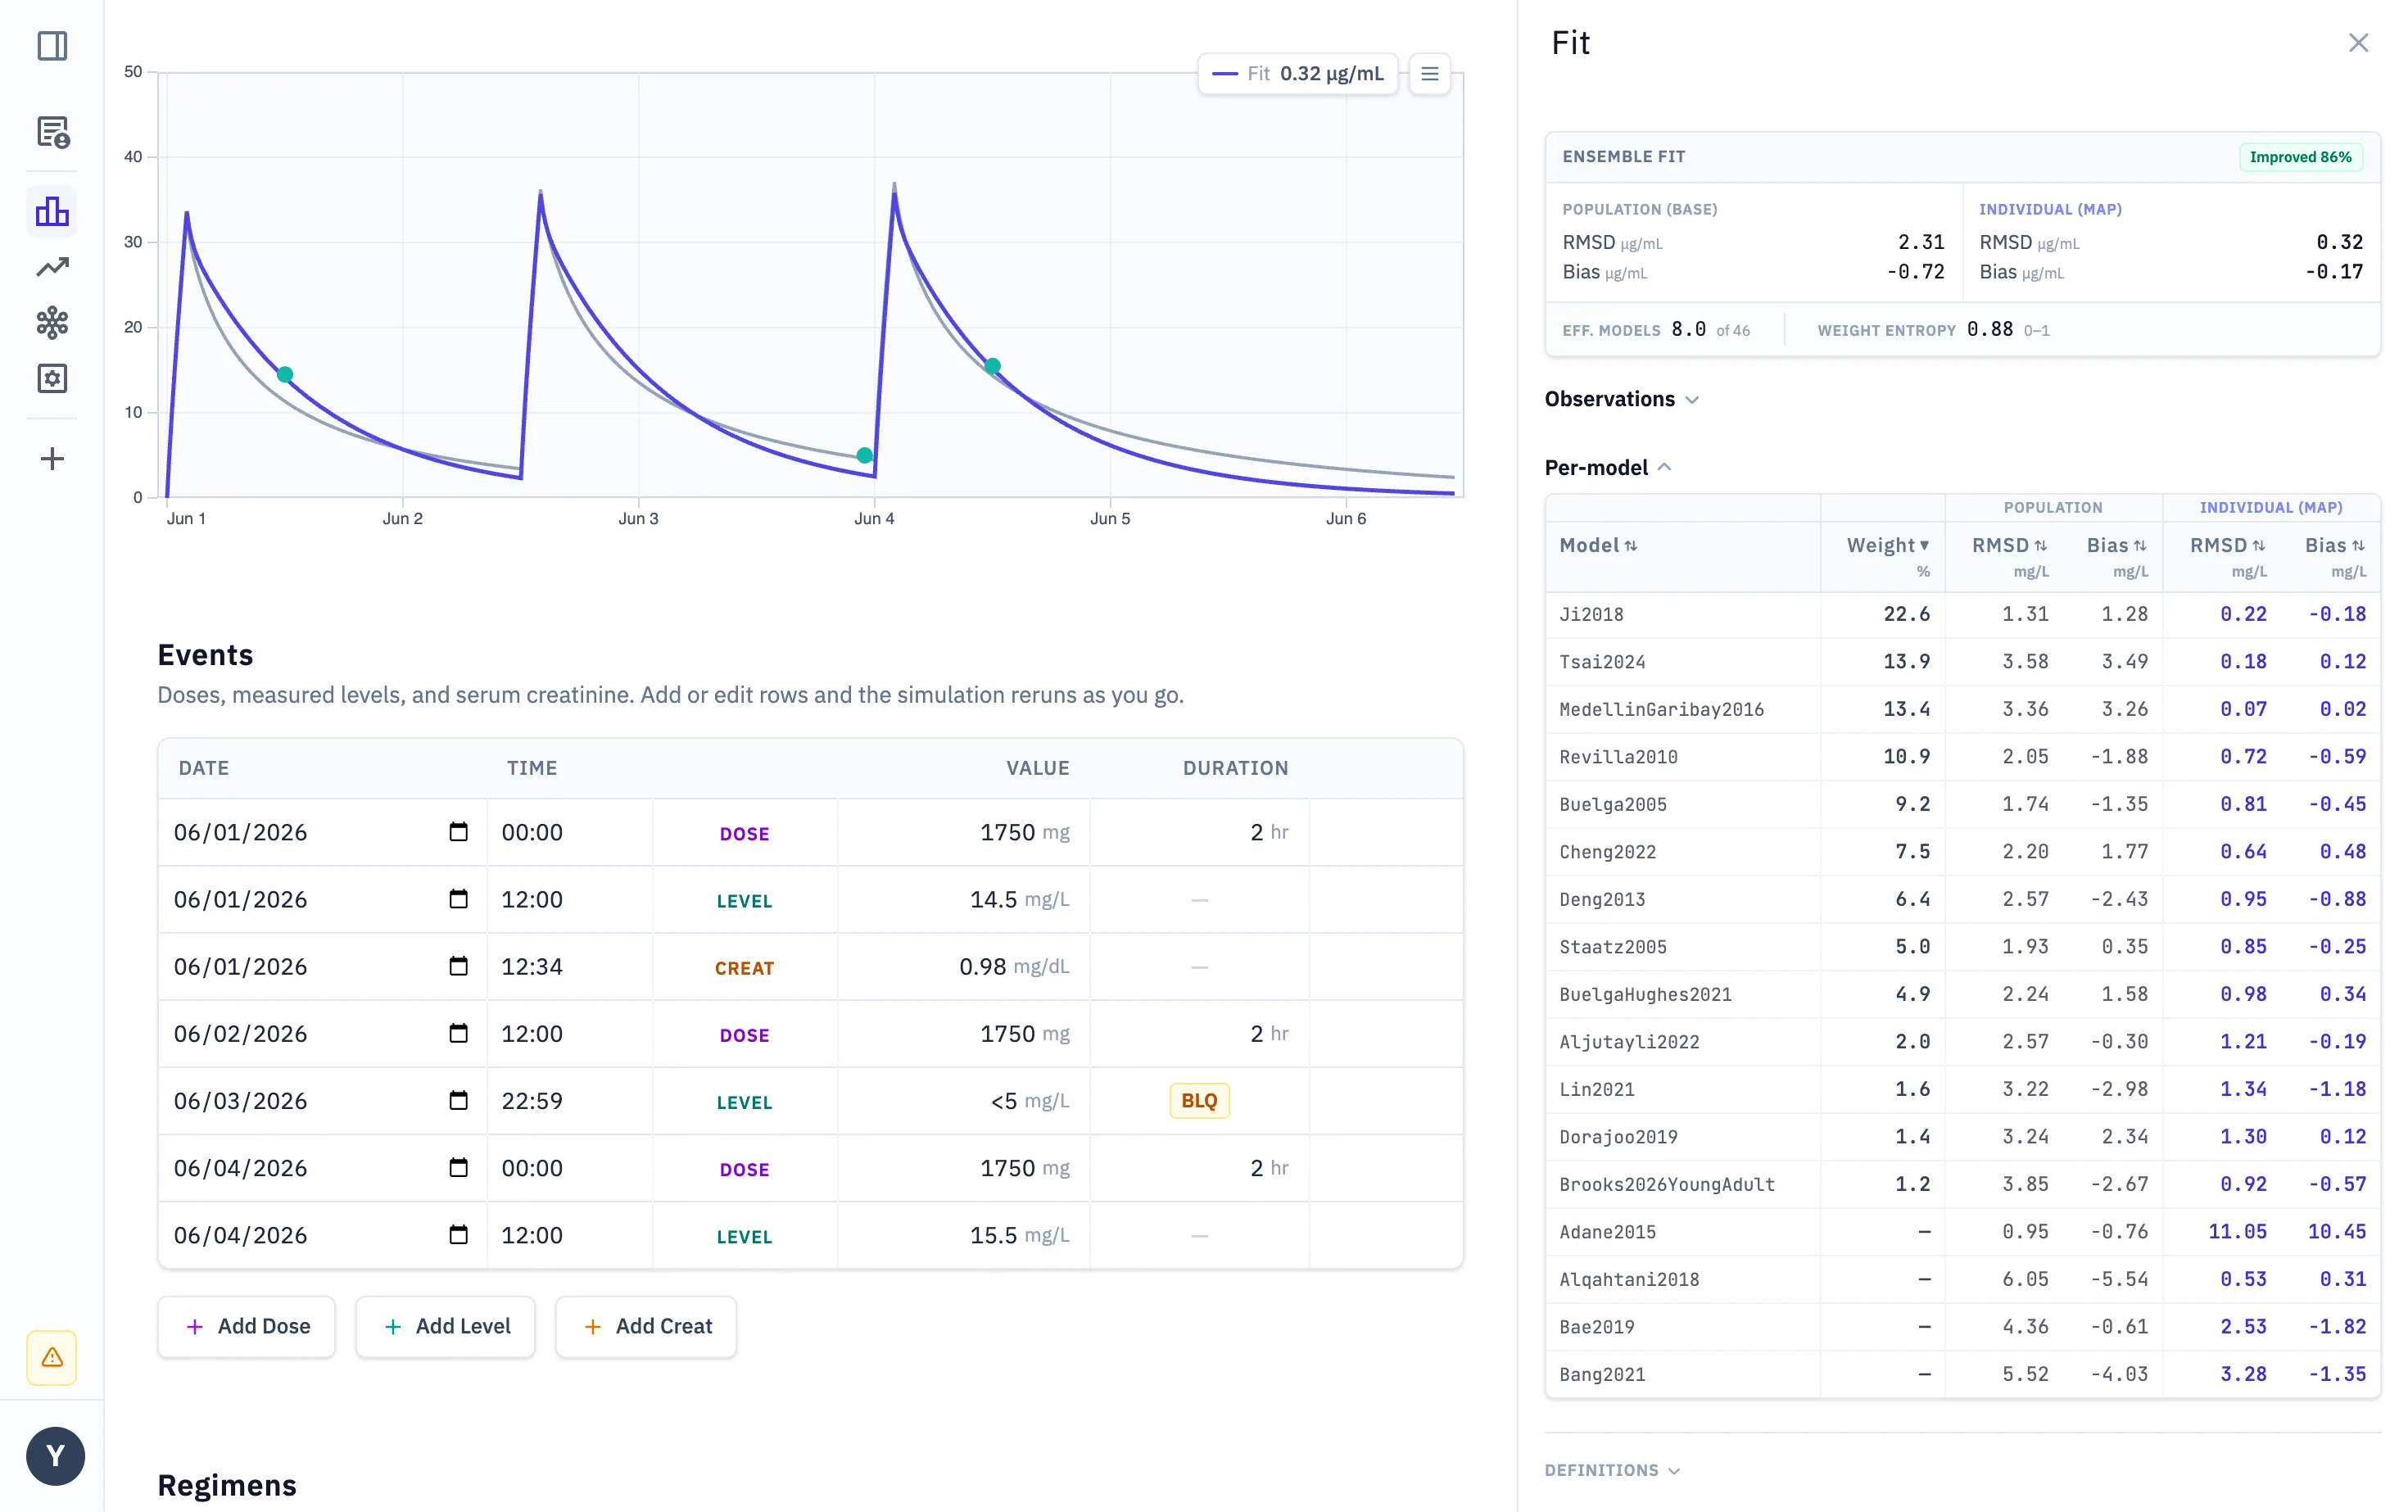
Chorus analysis view: the model-averaged fit curve through measured vancomycin levels, beside a per-model table listing each published model's averaging weight and fit error

Features

Client-Side & Zero-Footprint:
The simulation runs entirely in your browser, with nothing transmitted.
Longitudinal Renal Tracking:
Incorporates dynamic clearance changes across serial creatinine values, automatically flagging KDIGO-defined acute kidney injury.
Configurable BLQ Handling:
Enter below-quantification values directly, with customizable imputation rules and fitting weights.
Transparent Model Diagnostics:
Review each model’s averaging weight, residual error, and bias in an open diagnostic table.
Customizable Ensembles:
Filter the library by clinical cohort, select individual models, and choose between equal, error-based, or penalty-adjusted weighting.
Cohort Analysis & Model Selection:
Compare model performance across many scenarios, and train a selector that narrows the ensemble before the first level.
Regimen Optimization:
Simulates candidate dose-and-interval combinations, scoring each by its ensemble probability of achieving target steady-state AUC24.

Simulation settings

Models

selected

Dose candidates (mg)

Interval candidates (h)

Demographics

Physical characteristics.

kg
cm
yr

Copy scenario

rows · dates included

If this is a real patient, this table is PHI.